
In past five years, almost every large-cap company in the region can point to higher revenue, but, Interestingly, most of them cannot point to a clean link between revenue growth and shareholder value.
I had a look at financials of 28 of the region’s largest listed companies, 4-5 across each market, Singapore, Indonesia, Malaysia, Thailand, the Philippines, and Vietnam, spanning banking, telecom, energy, petrochemicals, industrials, consumer, and aviation. For each one I looked at revenue, EBITDA/net margin, return on equity (ROE), return on invested capital (ROIC), and market capitalization change, FY2019 vs. latest reported fiscal year.
The top Five key takeaways
1. Revenue growth was almost universal, but value creation was not: All but a handful of the 28 companies grew revenue since FY2019, yet nearly two-thirds either destroyed market value or merely held it flat in dollar/local-currency terms.
2. Banks were the region’s one dependable value engine: Every bank studied (DBS, OCBC, BCA, Bank Mandiri, Maybank, BDO, Vietcombank, BIDV) sustained or improved ROE, mostly in the 11–23% range, and their market values compounded roughly in line with that.
3. State-linked energy, petrochemicals and capital-intensive infrastructure sectors turned out to be the region’s biggest value gap: Telkom Indonesia, PTT, Petronas Chemicals, Siam Cement Group and Airports of Thailand all show ROIC compressing sharply. For Siam Cement’s case, it went to near zero and market value fell in a close proportion. It broadly highlighted a structural capital efficiency gap across these sectors.
4. Debt-funded scale-up diluted returns faster than it grew profit: CP All’s Lotus’s/Tesco Asia acquisition and Masan Group’s WinCommerce/Masan High-Tech Materials expansion both roughly doubled revenue while cutting ROE by more than half, this meant growth was bought at the expense of return on capital.
5. The market doesn’t always pay for better fundamentals right away: BDO Unibank, SM Investments and Jollibee all improved ROE meaningfully with flat-to-negative dollar market value (currency and multiple effects swamping real operating progress), a reminder that the market-fundamentals link, while real on average, isn’t instantaneous or guaranteed for any single company.
How this unfolded? Here’s the full breakdown.
Lets start with the baseline data points and see where the leading large-cap companies stand today. If we plot revenue CAGR against market value change since 2019, four distinct groups appear:
[Chart 1] Market value change vs. revenue CAGR, FY2019 → latest FY, all 28 companies
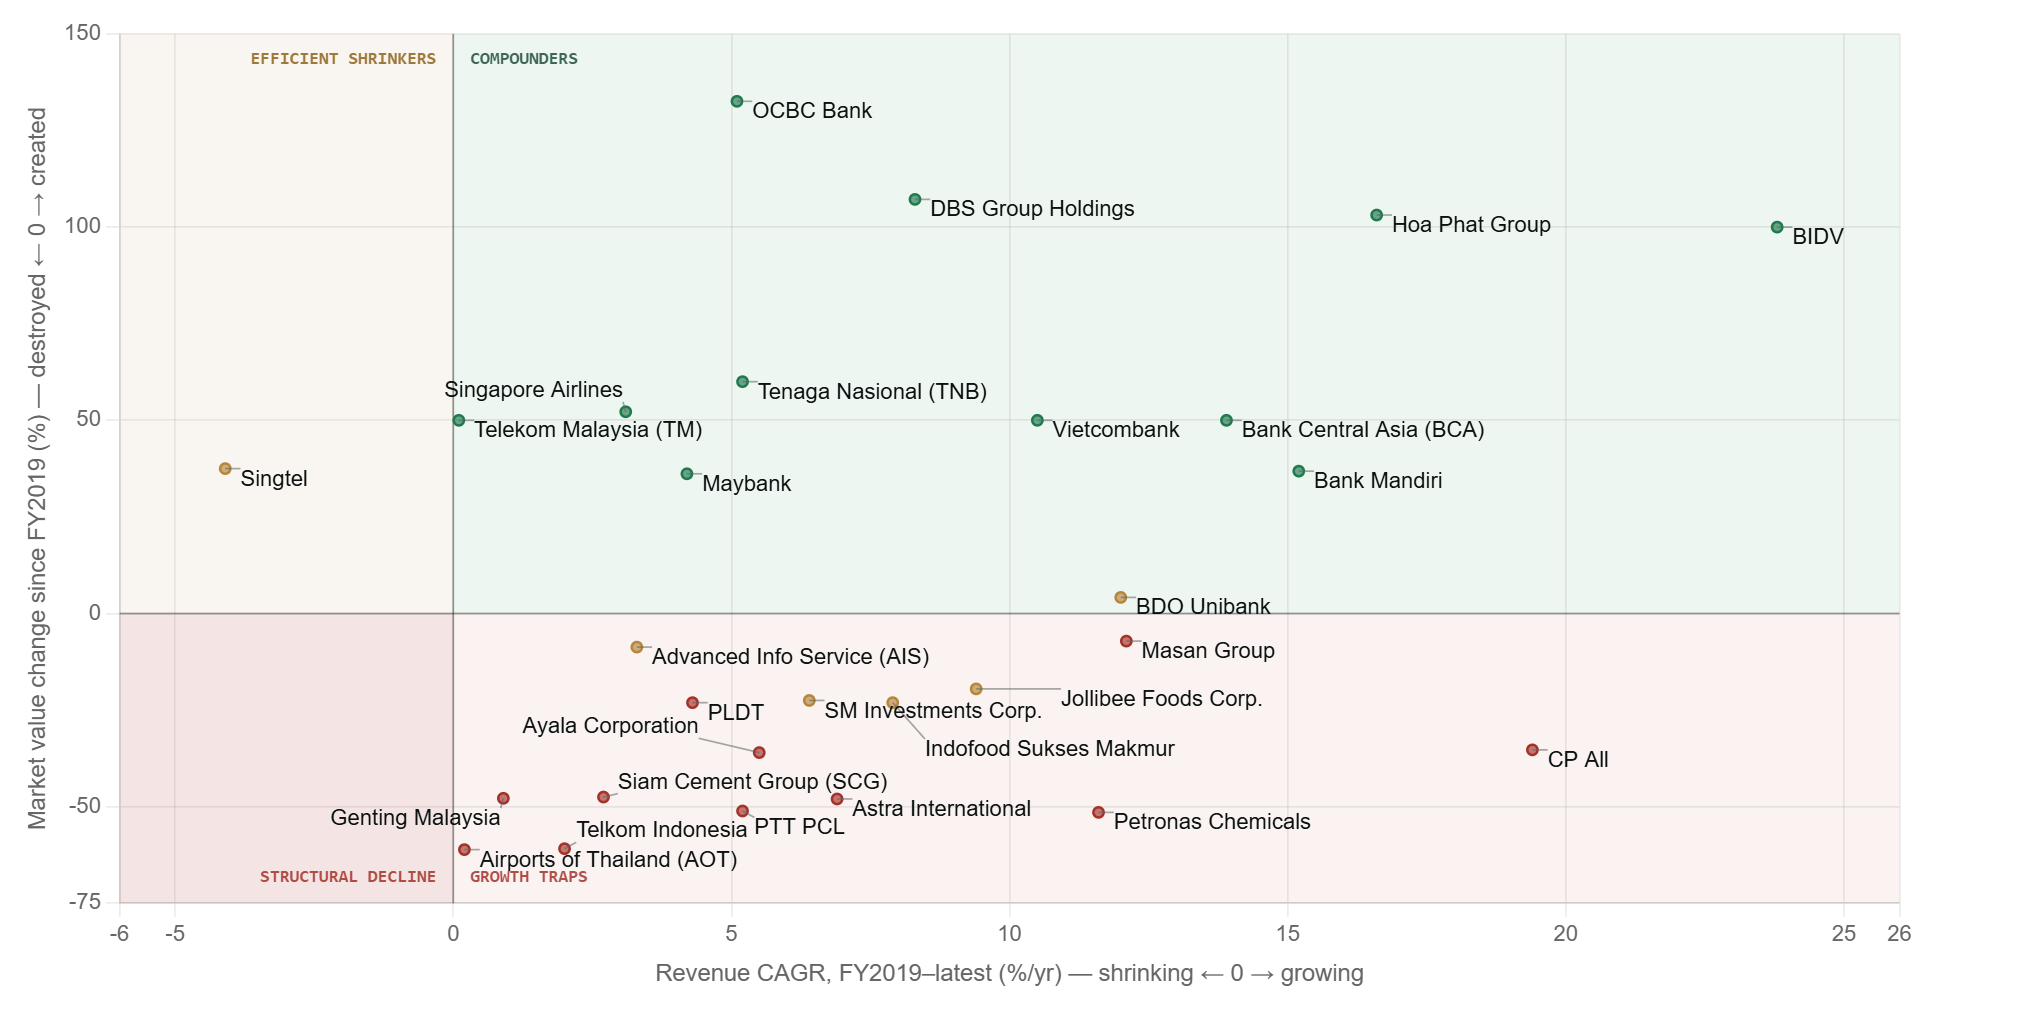
🟩 Compounders (top-right): Revenue grew and the market rewarded it. This is where nearly every bank in the sample sits, plus a handful of industrials.
🟨 Efficient Shrinkers (top-left): Revenue contracted, but the market still rewarded the stock, because returns on the smaller base improved.
🟥 Growth Traps (bottom-right): Revenue grew, but the market marked the stock down for structural reasons. It’s the most crowded quadrant.
⬛ Structural Decline (bottom-left): Revenue and value both fell. No one here.
Point size in the chart reflects the magnitude of ROE change; bigger the dot, the more that company’s return on equity moved (up or down) over the period. If you look closely, you will notice, most of the biggest dots cluster in the top-right and bottom-right corner, and not evenly across all four quadrants. This shows broader regional value contraction issue – ROE regionally contracted -1.8pts while ROIC contracted -2.0pts.
Banks turned out to be the regional flag bearers for value creation
Every bank in this analysis; DBS, OCBC, Bank Central Asia, Bank Mandiri, Maybank, BDO Unibank, Vietcombank, BIDV, sustained or improved ROE through the entire period, mostly landing in the 11–23% range. Their market values compounded roughly in line with that.
[Chart 2] Bank ROE and corporate ROIC, FY2019 vs. latest FY
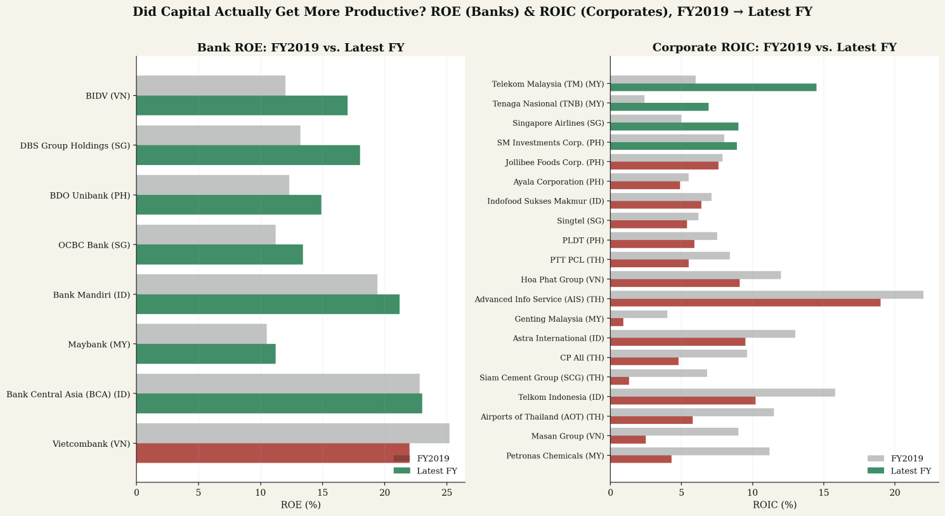
The left panel tells the story cleanly: every bank bar is green or close to flat. No commodity exposure, no capital-intensive infrastructure, no currency-translation drag on the underlying business, just disciplined loan growth, fee income, and (for the Singaporean banks especially) active capital return through dividends and buybacks.
Does the market even pay for better returns?
[Chart 3] Market value change vs. ROE change, FY2019 → latest FY
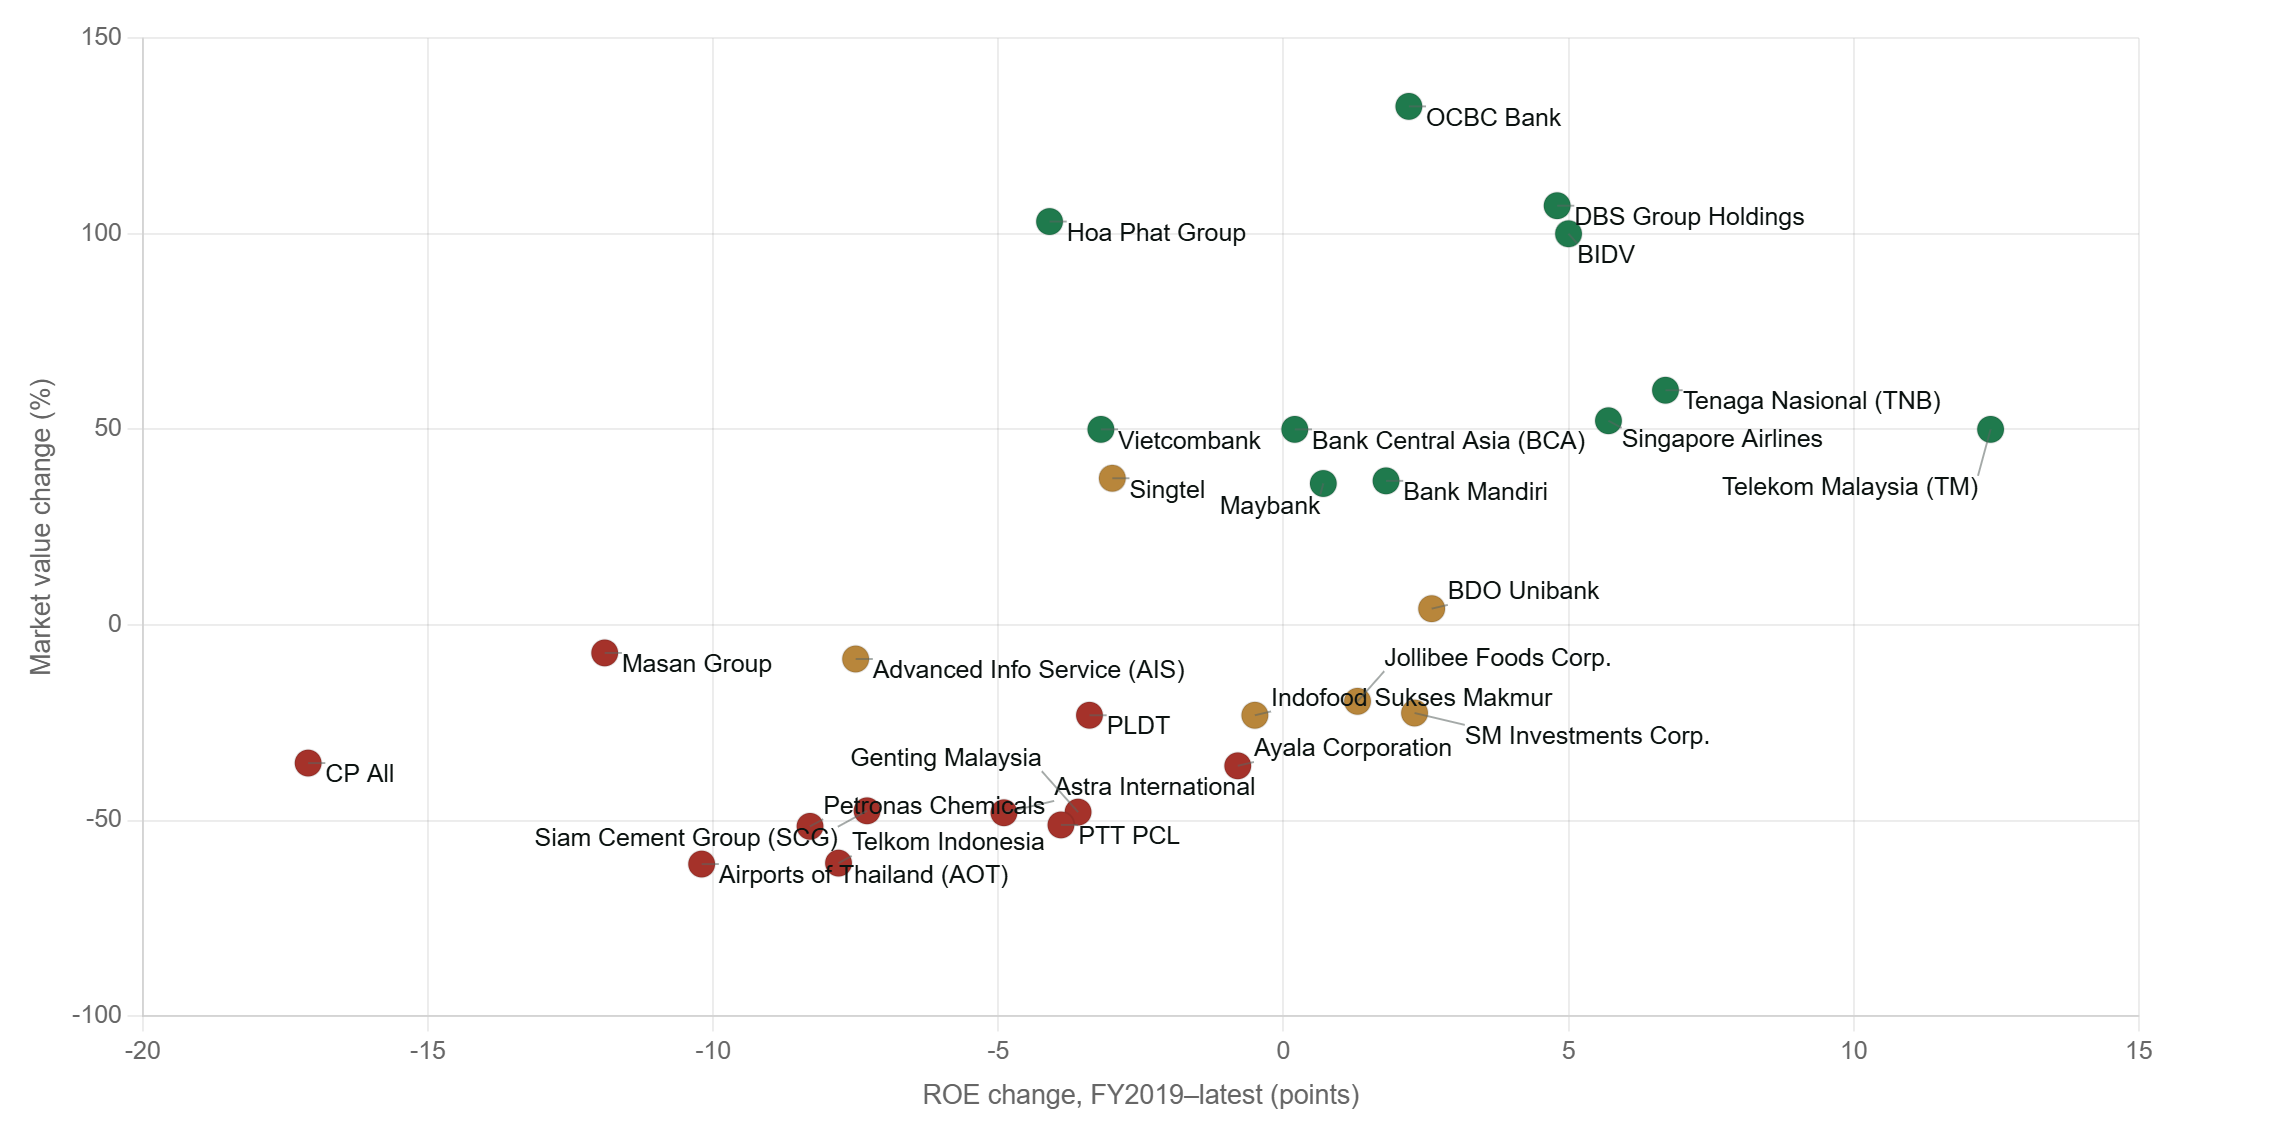
If markets were perfectly efficient, this chart would have shown a clean upward-sloping line: better ROE, better market value, every time.
But it isn’t clean at all.
Several companies improved ROE meaningfully and still saw flat-to-negative market value, a reminder that currency and country-level multiple effects can swamp real operating progress.
Where revenue growth didn’t pay? The five ways value got destroyed!
The right panel of the chart 2 above for corporate ROIC, shows an interesting view; roughly two-thirds of the 22 non-bank corporates saw ROIC compress, several of them sharply. When we dig deeper, five distinct triggers stand out.
1. The capital cycle caught up with capacity invesyment consuming the returns: Petrochemicals hit a capital cycle impact. Strong returns from the prev. cycle 2015-21, led to investment into a wave of new capacity during 2023-24, built specifically to reduce import dependence. This is a cyclical impact – high returns in capital-intensive commodity industries structurally attract the investment that later destroys those same returns, on a cycle of roughly 5–8 years and it continues to recur.
2. Scale was pursued as a strategic goal, not a return on capital: Building scale and market share as a defensive moat against domestic and foreign rivals, on the assumption that synergies would eventually justify the price paid. That bet only works if financing stays cheap long enough to bridge the gap; instead, the 2022+ global rate-hiking cycle raised the cost of servicing the acquisition debt at exactly the moment the assets still needed years to reach core-business returns. The strategic premise (scale now, returns later) collided with a macro financing driver. The CP All and Masan group deals (Lotus’s/Tesco Asia WinCommerce and Masan High-Tech Materials) are good examples in this context.
3. A systemic repricing of emerging-market capital: The fastest US rate-hiking cycle in decades (2022–23) mechanically raised the discount rate applied to every emerging-market cash flow, pulling portfolio capital out of Emerging Market equities and into US fixed income, a macro reallocation that hits Philippine and Indonesian stocks regardless of what the underlying company did. It compounds further when the market persistently penalizes “holding company / conglomerate” for opaque capital allocation and governance risk that was common to family-controlled structures across the region.
4. ICT backbone companies not looking at restructuring the core, but trying to buy out of the disruption: Telcos who were facing digital-platform disruption of traditional telecom revenue pools, chose to acquire the new disruptors, rather than restructure or reprice their own core network business; a classic incumbent’s-dilemma response that diverts capital into a stake it doesn’t control instead of reinvesting in the business it does. When that stake was written down, the capital allocated to a defensive hedge was lost outright, while the core competitive pressure remained unresolved.
So, where is the future promise and the underlying risks?
The reliable value creators, overwhelmingly banks, plus a couple of businesses that fixed a structural inefficiency rather than chasing growth, protected or improved ROE/ROIC through the cycle.
The value destroyers, even the ones that grew revenue substantially, did so either by taking on leverage that diluted returns, by riding a commodity cycle down, or by operating in a capital-intensive, travel-exposed sector that still hasn’t recovered its pre-pandemic earning power.
A key takeaway for investors: Structural moves that protected margins and return on invested capital created value, while growth funded by debt or acquisitions usually destroyed value unless it delivered an immediate improvement in returns.
So, beyond banks, who carries the next growth torch in the region?
1. Digital & AI infrastructure: Global hyperscaler capex is flowing disproportionately into Southeast Asia on land availability, energy access and proximity to major North and South Asian markets; the region is actively positioning itself as Asia’s AI-compute hub, and telecom incumbents across multiple markets are already monetizing towers, fiber and land banks to fund the build-out
The Risk: Capital intensity is enormous and mostly leverage-funded, land/power/water constraints are underpriced in many current plans, and if hyperscaler capex discipline arrives, whoever built ahead of proven demand is left holding underutilized, high-fixed-cost assets with compressed returns. This is the same issue the current capital-intensive industries are already struggling with.
2. Advanced manufacturing & supply-chain diversification: “China+1” relocation: geopolitical rebalancing is structurally shifting electronics assembly, EV components, and mid-tech manufacturing into the region, a genuine multi-year, FDI-driven story is unfolding.
The Risk: The tailwind risk is geopolitical. A shift back toward reshoring or a change in tariff regimes could remove the rationale faster than committed capital can be repositioned, and there is real risk of regional overcapacity being built ahead of proven end-demand.
3. Renewable energy & grid transition: Regional decarbonization commitments and a wall of incremental electricity demand from data centres and EV adoption create a multi-decade capital requirement, one of the few themes with genuinely visible, structural demand growth for the next 20 years.
The Risk: This analysis already shows what happens when regulated-utility returns are mispriced for years before a correction. Long payback periods and state-linked entities building ahead of bankable offtake agreements are the specific dangers here.
4. Consumer digital economy & fintech: A young, increasingly urban, increasingly banked population gives this sector genuine structural runway, and unit economics have matured considerably since the cash-burn era of 2019–2021.
The Risk: The 2021 digital-economy boom left several large industrial and telecom balance sheets holding equity stakes that were substantially written down within two years, a direct, visible drag on the returns documented in this analysis. If capital chases the theme again ahead of proven, durable unit economics, the same value-destruction cycle is the most likely outcome.
The uncomfortable precedent
Southeast Asia has already run a version of this experiment once. Capital poured into the region’s 2021 digital-economy boom before unit economics were proven, and the resulting write-downs are a visible, lingering drag on the balance sheets that took equity stakes in that wave. The lesson for whichever sector picks up the torch next is the same: regional capital has a recent, demonstrated habit of underwriting a growth narrative before the underlying returns are proven and then paying for that mistake in ROIC and market value for years afterward. The promise in each of these four sectors is real. So is the region’s track record of underwriting it too early.


Leave a Reply